Image used for thumbnail courtesy of EPA(https://www.epa.gov/pm-pollution/particulate-matter-pm-basics).
Disclaimer: Please note that the information presented in this article is for informational purposes only. It is not intended to serve as health advice, engineering advice, or any form of professional guidance. Readers should consult with qualified professionals for specific health or engineering concerns and should not rely solely on the content of this article for making decisions. The authors and publishers of this article are not responsible for any actions taken based on the information provided herein.
This article is more how to whip up a PM sensor using easily found components than actual health based knowledge beyond some sort of cursory why should I care. I would defer to my substack at https://jesseandersonresearch.substack.com/ which will end up as https://research.jesse-anderson.net/ as soon as I decide I want to give Substack $50 to change the routing(eventually?) for anything health related. However, what’s the point in knowing how to build something if you don’t know why you’re building it? For that we can do a basic primer as you’ll see below:
Why Particulate Matter (PM) Deserves Attention
What it is
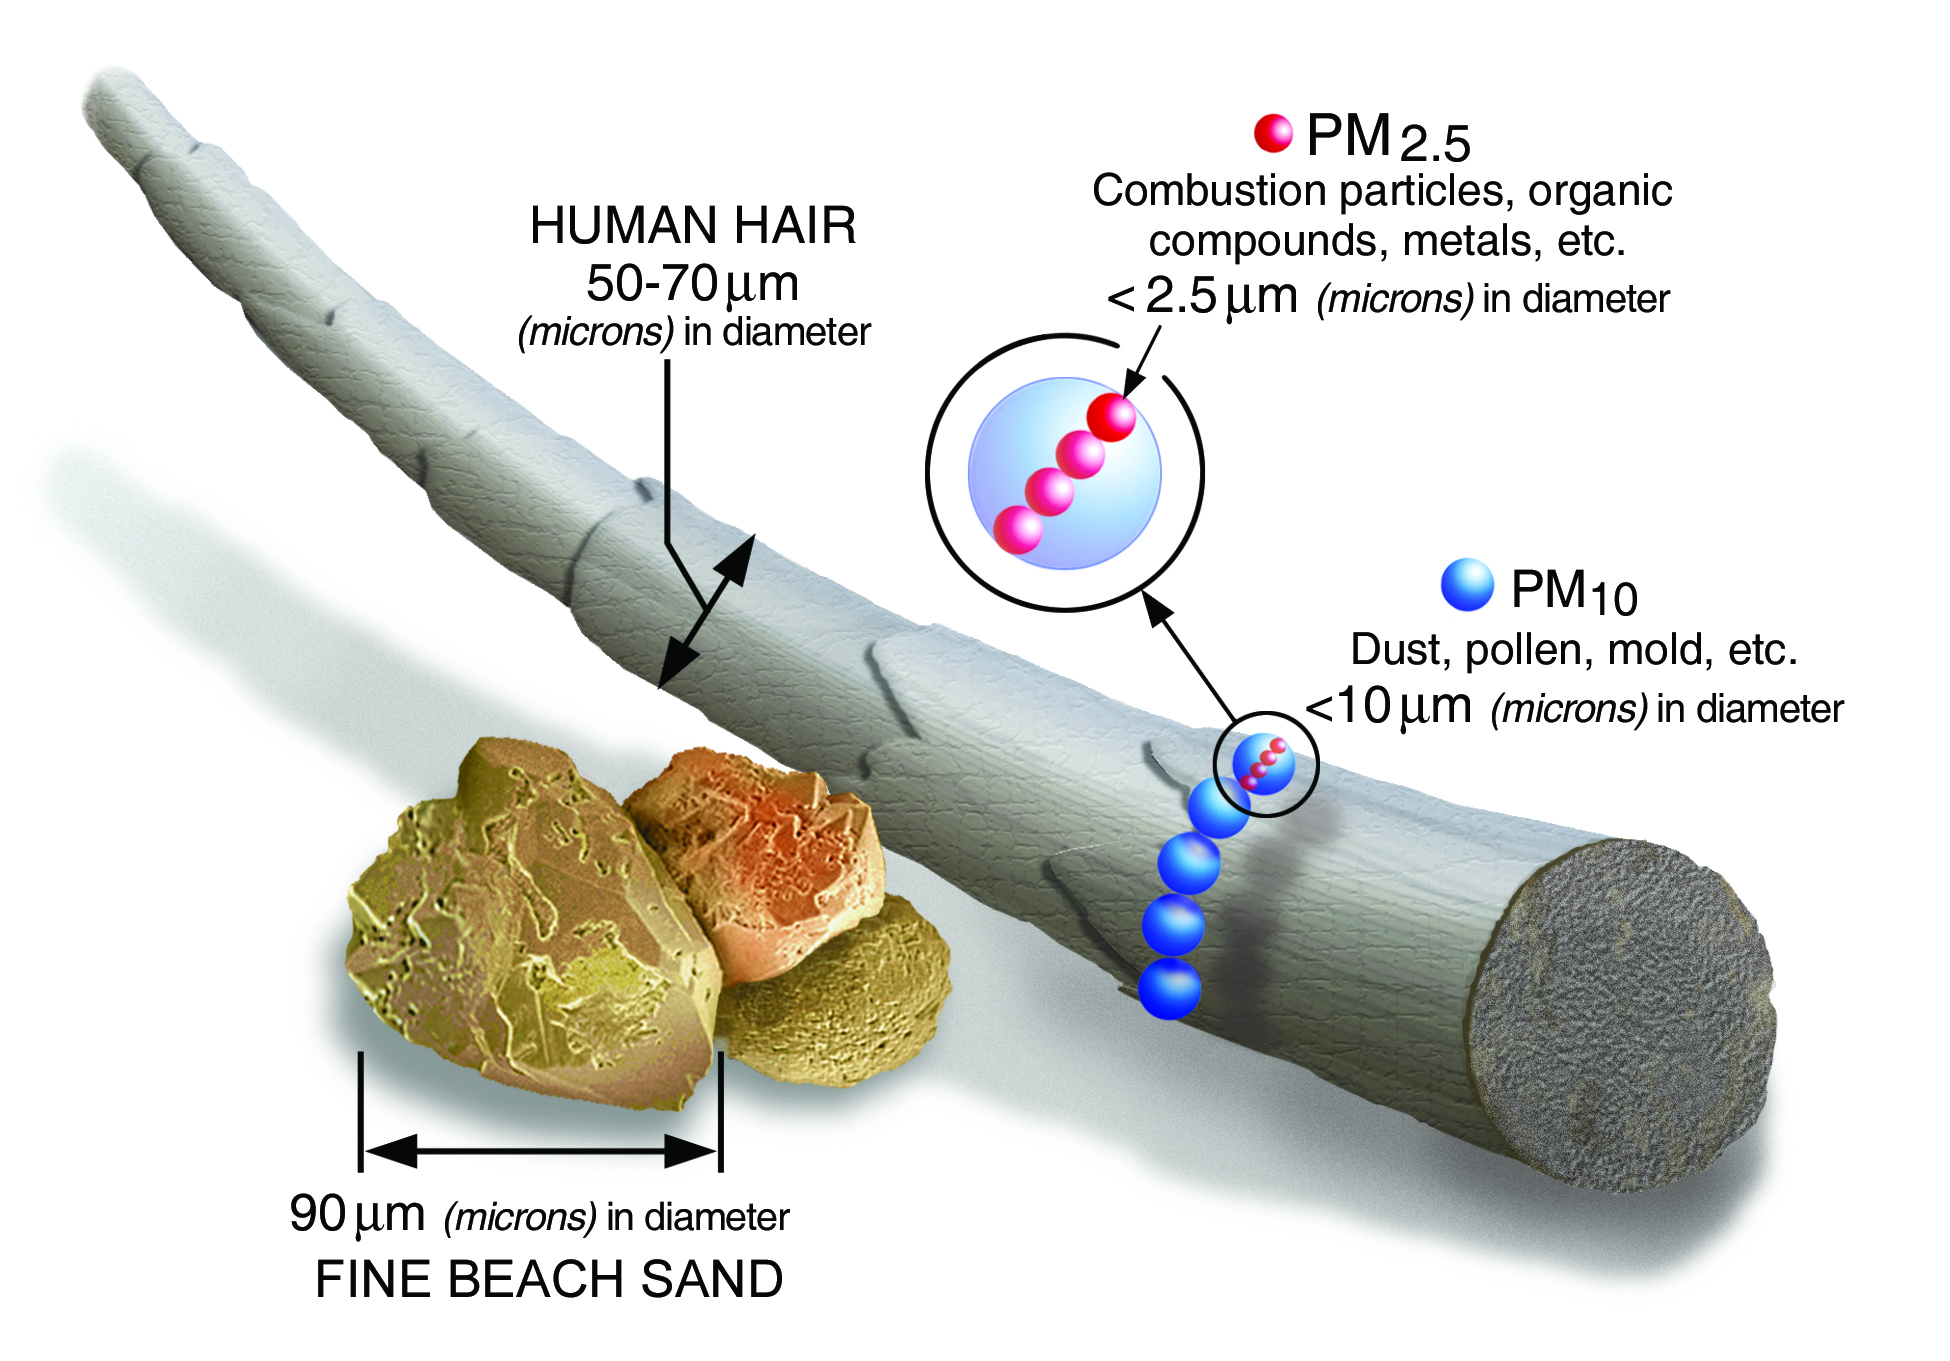
PM10 - particles up to 10 µm, mostly from mechanical processes such as road dust and construction.
PM2.5 - particles up to 2.5 µm, dominated by combustion sources like vehicles, wildfires and power plants.
PM1 - particles up to 1 µm, often secondary aerosols or diesel and wood smoke; they can cross the alveolar membrane, enter the bloodstream and drive systemic inflammation.
Why it is harmful
A recent meta-analysis reported an 11 percent rise in cardiovascular mortality for every 10 µg m⁻³ long-term increase in PM2.5 exposure [6].
PM2.5 now contributes to about 8.1 million premature deaths each year worldwide - 58 percent from ambient PM2.5 and 38 percent from household air pollution [3]. The report mentioned in the reference is actually really good, with lots of visuals and a pretty easy read!
Toxic metals, black carbon and polycyclic aromatic hydrocarbons adsorb onto particulates, adding carcinogenic and oxidative-stress burdens.
PM1 is theorized by [13] to cause 13.1% and 15.3% elevated risk of overall and essential hypertension hospitalization respectively.
What “safe” looks like and how the world actually measures up
Particulate matter
| Metric | WHO 2021 guideline | US EPA 2024 NAAQS | Research-based PM1 target | Typical real-world figures* | Health message |
|---|---|---|---|---|---|
| PM1 annual mean | - | - | 2 µg m⁻³ chronic reference concentration [11] | 17.4 ± 2.8 µg m⁻³ cohort mean, Guangzhou 2015-2020 [13],national mean 32.3 → 16.8 µg m-3 from 2014-2018 (satellite maps)[15] | Ultrafine fraction crosses into blood; risk rises steeply at low levels. |
| PM1 24 h mean | - | - | ≤ 10 μg m⁻³ based on minimal risk increment from major epidemiological study[12] | 27 µg m⁻³[Indonesia] 13.9µg m⁻³[Taiwan] personal average in microsensor study [14]. Ambient air in Taiwan 20.5µg m⁻³ | Short peaks depress heart-rate variability and trigger arrhythmias. |
| PM2.5 annual mean | 5 µg m⁻³ [1] | 9 µg m⁻³ [2] | - | 31.3 µg m⁻³ global pop-weighted mean, 2021 [3] | 99% of the world’s population live in places with unhealthy PM2.5 levels. |
| PM2.5 24 h mean | 15 µg m⁻³ [1] | 35 µg m⁻³ [2] | - | > 100µg m⁻³ during wildfire smoke, 8 Jun 2023 [7] | Acute spikes drive arrhythmias, asthma and stroke risk. |
| PM10 annual mean | 15 µg m⁻³ [1] | - | - | Remote western deserts often exceed 42 µg m⁻³[16] | Coarse dust irritates airways and carries microbes. |
| PM10 24 h mean | 45 µg m⁻³ [1] | 54 µg m⁻³ [2] | - | Dust storms can top 5000+ µg m⁻³[16] | Triggers emergency warnings. |
Gaseous pollutants regulated by WHO and EPA
| Pollutant & averaging time | WHO 2021 guideline | US EPA 2024 NAAQS | Typical real-world figures | Quick take |
|---|---|---|---|---|
| O3 | 60 µg m⁻³ [8hr avg over six months with greatest average O3 conc.][1] 100 µg m⁻³ [8hr avg] |
0.054 ppm ≈ 106 µg m⁻³ [8hr] [2] 0.125ppm ≈ 245 µg m⁻³ [1hr] [unhealthy for sensitive groups][2] |
Peak-season global value of 60 µg m⁻³ or 31ppb exceeded for 93% of the world population.[8] US value: 27 to <39ppb [8] |
Photochemical smog worsens in heatwaves. UV + NOx + VOC = :( |
| NO2 | 10 µg m⁻³ [Annual][1] 25 µg m⁻³ [24 hour][1] |
53 ppb ≈ 99.6 µg m⁻³ [1hr][2] | High income countries avg 25.5 µg m⁻³ and 6.5 µg m⁻³ low income [8] US value: 13 to 19 µg m⁻³[8] |
Traffic pollutant tied to childhood asthma. |
| SO2 | 40 µg m⁻³ [24 h][1] | 35ppb ≈ 91.7 µg m⁻³ [1hr] [2] 10ppb ≈ 26.2 µg m⁻³ [1yr] [19] |
US national 1hr mean 3 to 13.9 ppb ≈ *** µg m⁻³ 2023[9] | Coal/oil facilities can emit 10× more SO2 than neighboring industrial plants, with legacy operations releasing millions of pounds annually despite WHO limits[17]. |
| CO 24 h mean | 4 mg m⁻³ [1] | 4.4ppm ≈ 5.0 mg m⁻³[8hr][2] | Gas-stove-free homes average: ~0.6 - ~6 mg m⁻³ | 0.5 to 5ppm Levels near poorly adjusted stoves >30ppm | 34.35 mg m⁻³[10] |
Good indoor sensors alert long before legal limits. |
I generally just use the WHO values as a basis, but I’m including the US values as a comparison. Unless stated otherwise I’m taking the ideal values where they exist, if the values correspond to an unhealthy for sensitive groups, etc it will be shown in brackets.
A Cautionary Tale
To dive a bit more into the whole sulfur issue and monitoring lacking(a bunch of missed days…).. The inadequacy of sulfur monitoring becomes starkly apparent during environmental disasters, as demonstrated by a 2022 study of Beaumont, Texas - a city surrounded by major petroleum refineries. When Hurricane Harvey struck in August 2017, the community’s already limited air monitoring network essentially went dark at the worst possible time. With only two monitors covering the entire industrial city, officials shut down equipment for a full week (August 25-September 1) to prevent storm damage, leaving residents without any data on air quality while refineries were in operation. The hydrogen sulfide monitor was particularly unreliable, missing 213 days of data in 2017 alone, with overall data capture rates plummeting to just 39% during the hurricane period. Even when operational, the monitor consistently recorded hydrogen sulfide concentrations above OSHA safety limits at levels residents could smell daily. This case illustrates how monitoring gaps compound during crises: precisely when industrial accidents and emergency shutdowns release the most pollution, communities lose the data needed to assess health risks[18].
As an aside, OSHA considers Sulfur Dioxide 5ppm or 13 mg m⁻³ to be permissible exposure limit, 10 hr time weighted average 2 ppm for their recommended exposure limit[20]. The values seen above according to the data in the journal article show an average of 0.68ppb in 2017 and an H2S RfC of 1.0 ppb for the general population[21]. This is in contrast to the 0.14ppb value that is cited in the journal. Overall, with the missing sensor days, dated EPA guidelines, and general confusion in interpreting these values it becomes even more critically important to monitor one’s environments for particulate and chemical matter.
Why include these gases in a DIY station?
Electrochemical and MOS chips are inexpensive and socket-friendly but drift over months – especially SO2 and O3 cells that consume electrolyte. A modular stack lets you swap a single daughter-board instead of rebuilding the whole monitor, keeps recalibration simple and preserves the data stream. Also note that ionizers and some photocatalytic filters generate ozone as a by-product, so having an O3 channel is prudent. Its pretty cheap to get the boards direct off aliexpress and swap every now and then(the electrochemical ones you can also set to turn on once an hour or so which will greatly prolong life!).
Why monitor PM yourself
Regulatory gaps - government stations provide perhaps one reading per county; your micro-environment can differ wildly near traffic, grills or printers.
Short events - cooking, candles and yard burns create hour-scale spikes invisible in 24-h averages.
Personal health optimisation - live data lets asthmatics, COPD patients and athletes ventilate or mask up before symptoms hit.
Community science and advocacy - crowd-sourced maps have triggered filter giveaways and “clean-air room” programs during wildfire crises.
Targets when deploying a sensor build
Indoor annual goal - keep PM2.5 below 5 µg m⁻³ and PM1 below 2 µg m⁻³.
Ventilation trigger - alarm or start fans if indoor PM2.5 > 15 µg m⁻³ or PM1 > 10 µg m⁻³ for more than 15 min.
Outdoor module siting - breathing height, at least 2 m from walls and clear of exhaust vents. Refer to sensor documentation for additional details!
References
World Health Organization. WHO Global Air Quality Guidelines – Particulate Matter, Ozone, Nitrogen Dioxide, Sulfur Dioxide and Carbon Monoxide. 2021.
United States Environmental Protection Agency. National Ambient Air Quality Standards (NAAQS) Table, revised 7 Feb 2024.
Health Effects Institute. 2024. State of Global Air 2024. Special Report. Boston, MA:Health Effects Institute.
Shah K B et al. Dataset on indoor and outdoor PM2.5 at two South-Texas residences. Data in Brief, 19 Mar 2025.
Batty D. “Gas hob can raise indoor air pollution higher than busy UK road.” The Guardian, 7 Mar 2025.
Bourdrel, Thomas, et al. “Cardiovascular Effects of Air Pollution.” Archives of Cardiovascular Diseases, vol. 110, no. 11, Nov. 2017, pp. 634–642, www.sciencedirect.com/science/article/pii/S1875213617301304, https://doi.org/10.1016/j.acvd.2017.05.003..
Chen, Kai, et al. “Canadian Wildfire Smoke and Asthma Syndrome Emergency Department Visits in New York City.” JAMA, 21 Sept. 2023, jamanetwork.com/journals/jama/article-abstract/2809900?resultClick=1, https://doi.org/10.1001/jama.2023.18768.
Health Effects Institute. State of Global Air ozone and nitrogen-dioxide fact-sheets, 2025.
United States Environmental Protection Agency. Sulfur Dioxide Trends, Air Trends Summary 2023.
United States Environmental Protection Agency. Carbon Monoxide’s Impact on Indoor Air Quality fact-sheet, 2025.
Zaitseva N V et al. “On the safe levels of micro-sized particles PM1.0 in ambient air.” Hygiene and Sanitation 103(11):1434-1440, 2024.
Chen, Gongbo, et al. “Effects of Ambient PM 1 Air Pollution on Daily Emergency Hospital Visits in China: An Epidemiological Study.” The Lancet Planetary Health, vol. 1, no. 6, 1 Sept. 2017, pp. e221–e229, https://doi.org/10.1016/s2542-5196(17)30100-6. Accessed 23 Apr. 2023.
Zhang H et al. “Loundefinedng-term PM1 exposure and hypertension hospitalisation in South China.” Science of the Total Environment 903:167985, 2024.
Lung S-C C et al. “Peaks, sources and immediate health impacts of PM2.5 and PM1 exposure in Indonesia and Taiwan with microsensors.” Journal of Exposure Science & Environmental Epidemiology 35:264-277, 2025.
Wei, Jing, et al. “Satellite-Derived 1-Km-Resolution PM1 Concentrations from 2014 to 2018 across China.” Environmental Science & Technology, vol. 53, no. 22, 14 Oct. 2019, pp. 13265–13274, https://doi.org/10.1021/acs.est.9b03258.
Argyropoulos, Christos D, et al. “Measurements and Modelling of Particulate Matter Building Ingress during a Severe Dust Storm Event.” Building and Environment, vol. 167, 1 Jan. 2020, pp. 106441–106441, https://doi.org/10.1016/j.buildenv.2019.106441. Accessed 2 May 2024.
Daly, M. “A Port Arthur plant is spewing harmful sulfur dioxide. Texas won’t step in.” Houston Public Media, November 2, 2021
Adair K, Miller S, Gage Witvliet M. An Exploratory Investigation of Government Air Monitoring Data after Hurricane Harvey. Int J Environ Res Public Health. 2022 May 3;19(9):5559. doi: 10.3390/ijerph19095559. PMID: 35564954; PMCID: PMC9100209.
EPA. “NAAQS Table | US EPA.” US EPA, 15 Mar. 2023, www.epa.gov/criteria-air-pollutants/naaqs-table.
“SULFUR DIOXIDE | Occupational Safety and Health Administration.” Www.osha.gov, www.osha.gov/chemicaldata/549.
US. “IRIS Toxicological Review and Summary Documents for Hydrogen Sulfide (External Review Draft) | IRIS | US EPA.” Epa.gov, 2017, iris.epa.gov/document/&deid=29137. Accessed 12 July 2025.
May, N.W., Dixon, C., Jaffe, D.A. (2021). Impact of Wildfire Smoke Events on Indoor Air Quality and Evaluation of a Low-cost Filtration Method. Aerosol Air Qual. Res. 21, 210046. https://doi.org/10.4209/aaqr.210046
Xiang, Jianbang, et al. “Field Measurements of PM2.5 Infiltration Factor and Portable Air Cleaner Effectiveness during Wildfire Episodes in US Residences.” Science of the Total Environment, vol. 773, June 2021, p. 145642, https://doi.org/10.1016/j.scitotenv.2021.145642. Accessed 3 Feb. 2022.
Actual Sensor
So, I had originally intended to use a PMS7003, but after writing some C++ and running the PMS7003 against a Sensiron PM sensor I cannot in good faith recommend using the PMS7003. As such, I’ll just talk about the Sensiron SPS30(Not to be confused with the SEN5x) which has been calibrated to TSI DustTrak™ DRX 8533 Ambient Mode. It seems to hold up pretty well and is always within 80% of the actual value for PM2.5(a lot better than the randomness reported by PMS7003)[Link]. I preferred this one over the SEN5x since it’ll report the particle count and average while the 5x gives you humidity/temp/VOC/NOx index. I’d rather have this sensor + a standalone VOC/NOx sensor to decouple failure.
Anyhow, here’s some insights below(they will be updated as I measure data):
Soldering fume dissipation over time:
Comments